Index Surge: Amplifying Your Insights
Stay updated with the latest trends and news across various industries.
Visualize this: Turning Numbers into Masterpieces
Unlock the art of data! Discover how to turn numbers into stunning visuals that captivate and inspire. Transform your insights today!
The Art of Data Visualization: How to Transform Numbers into Compelling Stories
The Art of Data Visualization is a captivating discipline that elevates raw numbers into compelling narratives. In today’s data-driven world, where information is abundant, mastering the art of visualization is crucial for effectively communicating insights. By utilizing charts, graphs, and other visual tools, one can transform bland statistics into engaging stories that resonate with audiences.
To achieve impactful data visualization, consider these essential principles:
- Know Your Audience: Tailoring your visualization to the needs and understanding level of your audience enhances engagement.
- Keep It Simple: Avoid clutter; simplicity helps in highlighting the core message.
- Use Color Wisely: Colors can emphasize key points but should be used thoughtfully to avoid confusion.
By applying these principles, you can create visualizations that not only present data but also tell powerful stories that drive decisions and inspire action.

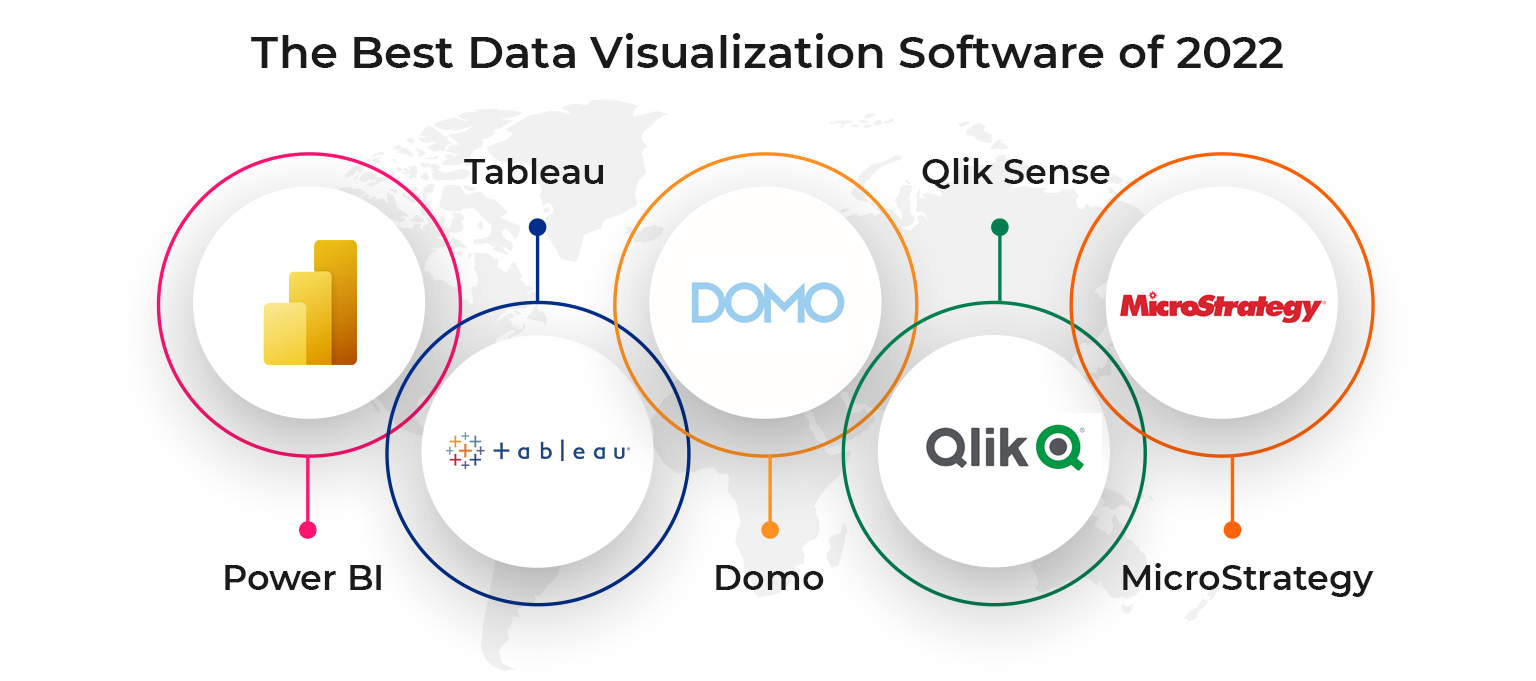
Top 5 Tools for Creating Stunning Visualizations from Your Data
In today's data-driven world, the ability to create stunning visualizations is crucial for effectively communicating insights. Here are the top 5 tools that can help you transform your raw data into engaging graphics that tell a compelling story:
- Tableau: Known for its intuitive interface, Tableau allows users to create interactive dashboards that can handle vast amounts of data effortlessly.
- Power BI: This Microsoft tool integrates seamlessly with other Microsoft products, making it an excellent choice for businesses already using the Microsoft ecosystem.
- Google Data Studio: A free tool that provides a collaborative platform for creating reports and dashboards, perfect for teams looking to visualize data without spending too much.
- QlikView: QlikView offers a powerful analytics and visualization experience, with strong data integration capabilities.
- D3.js: For those comfortable with coding, D3.js is a JavaScript library that allows creators to build custom, dynamic visualizations that can adapt to complex data sets.
Why Visualizing Your Data Matters: Insights and Benefits Explained
In today's data-driven world, visualizing your data is crucial for turning raw numbers into actionable insights. When we present data visually, whether through graphs, charts, or infographics, we enhance our ability to quickly grasp complex information. This approach not only helps in identifying trends and patterns that might be missed in traditional reports but also facilitates better communication of findings to team members and stakeholders. For example, a simple pie chart can effectively demonstrate market share distribution, making it easier for decision-makers to understand the competitive landscape at a glance.
Moreover, the benefits of visualizing your data extend beyond comprehension; it also plays a significant role in engagement and retention. Research shows that people retain information better when it is presented visually. Incorporating visuals in presentations or reports can create a more interactive experience, encouraging discussions and driving home key points. Ultimately, adopting effective data visualization techniques empowers organizations to make informed decisions and foster a culture of data-driven strategies, leading to improved performance and growth.